Utilize OpenTelemetry with Azure Application Insights
How to easily setup OTEL auto-instrumentation, connect to Azure Application Insights in Java, NodeJS, and Python applications.

Want to avoid scrolling endlessly through logs to find out why your application is misbehaving?
Want to track individual requests across multiple services?
Want to have a unified way of collecting telemetry data (logs, metrics, traces) from your applications?
Thankfully, thanks to the CNCF and its many contributors, we now have OpenTelemetry: A comprehensive suite of APIs, libraries, and tools that bring observability to your applications. It’s a one-stop shop for all your telemetry needs. In this blog post, we’ll explore how to set up OpenTelemetry in your application and send data to Azure Application Insights (or any other OpenTelemetry-compatible endpoint).
1. What is OpenTelemetry?
Metrics, Logs, and Traces
Let’s start with the basics. The three pillars of observability are logs, metrics, and traces, also known as signals.
Logs
Logs are the most basic form of telemetry data. They are typically unstructured text messages that are generated by applications and services. Logs can be used to record events, errors, and other important information about the state of an application. Error messages are especially important as they can help identify issues in the application.
While logs are familiar to most developers—since every application already produces them—instrumenting logs with OpenTelemetry and using structured logging can make it much easier to correlate logs with traces and metrics. This enables better analysis of issues and helps you quickly find the right logs for a specific request.
Traces
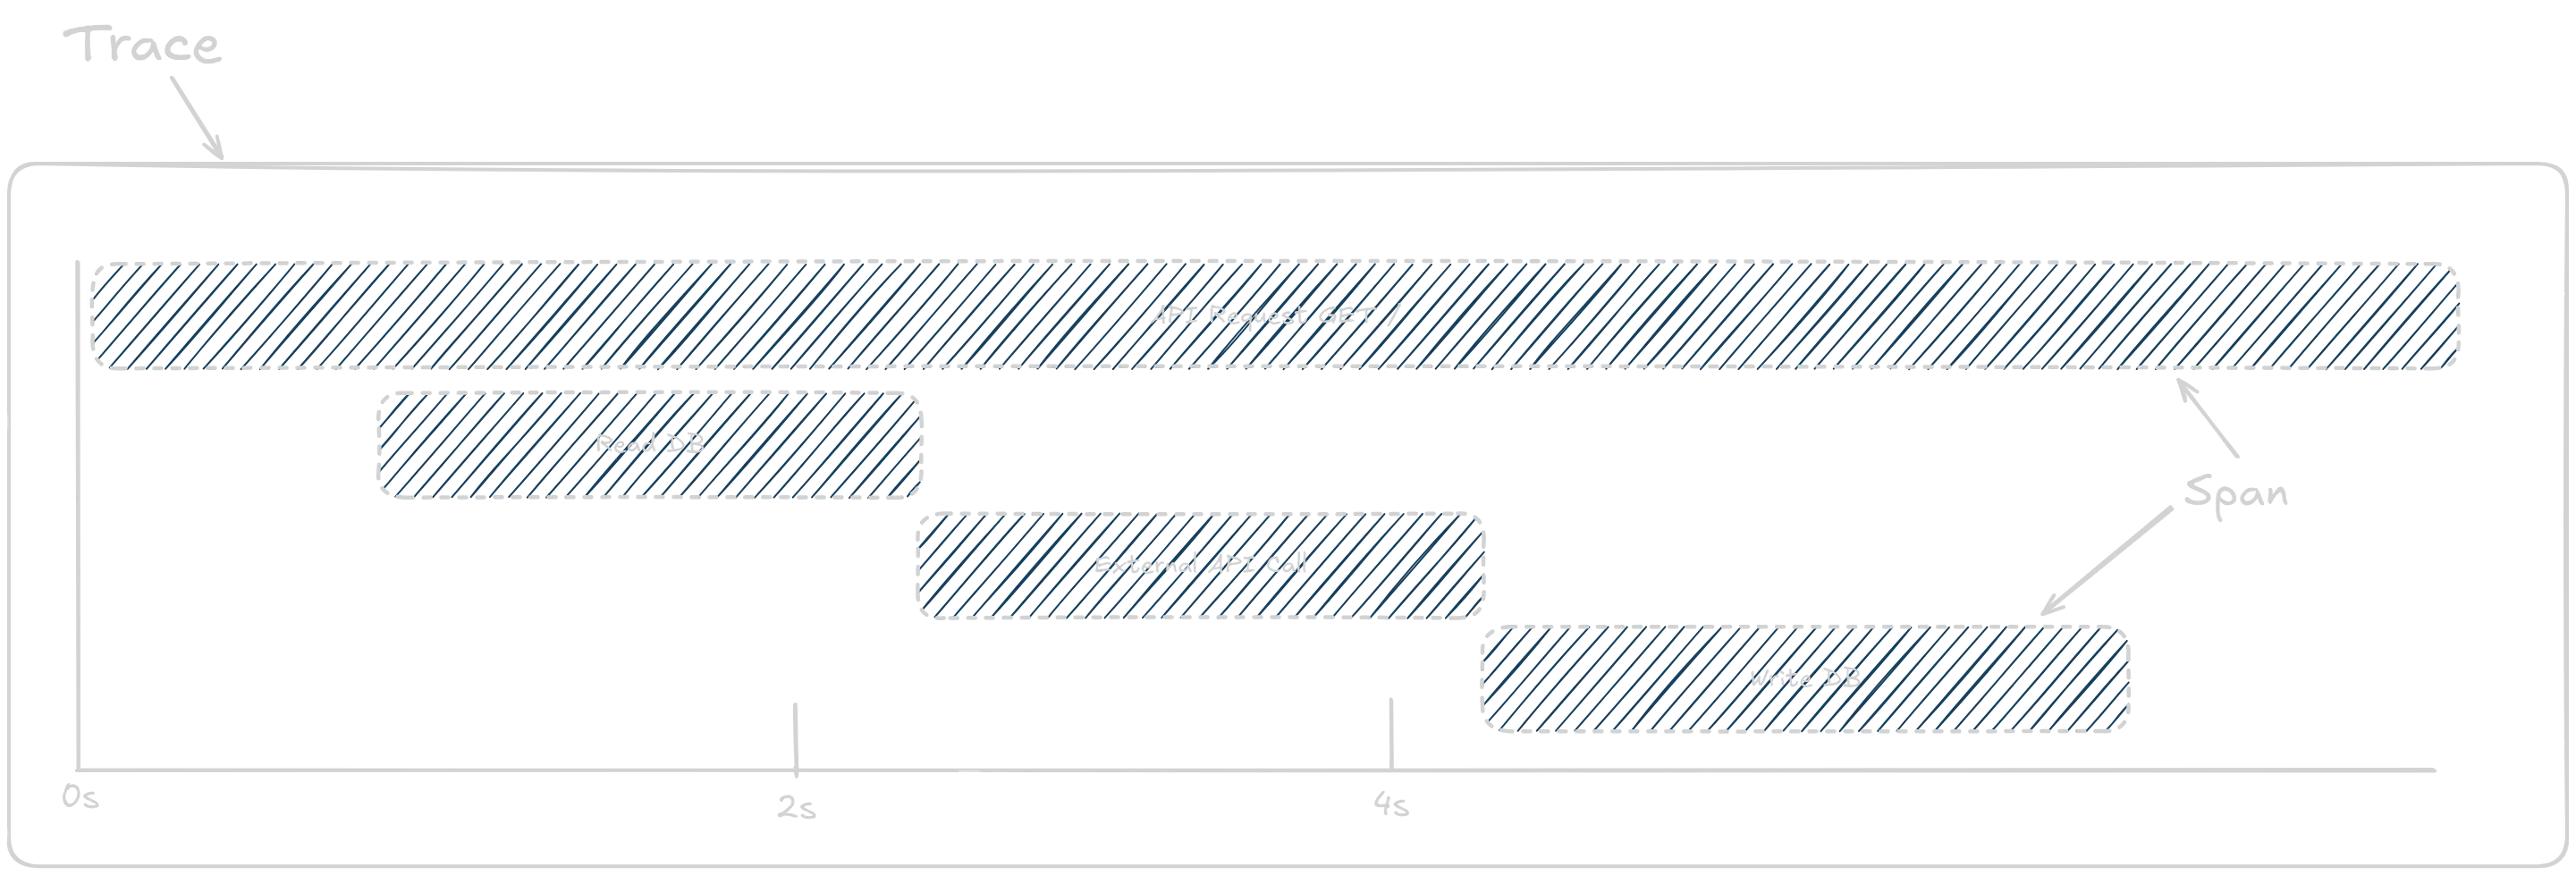
Traces let you follow the flow of a request through your application. They consist of a series of spans, each representing an individual operation within the request. Every span has a start time, end time, and metadata describing the operation. Traces help you identify performance bottlenecks, errors, and other issues. For example, a trace might represent an HTTP request to an API and subsequent calls to databases or other services, with each step shown as a span—allowing you to see the entire journey of a request and pinpoint where delays or errors occurred.
Traces become especially powerful in distributed systems with multiple services communicating. In these scenarios, traces help you follow requests across service boundaries and identify issues that may originate in another service—problems that would otherwise be difficult to correlate.
Metrics
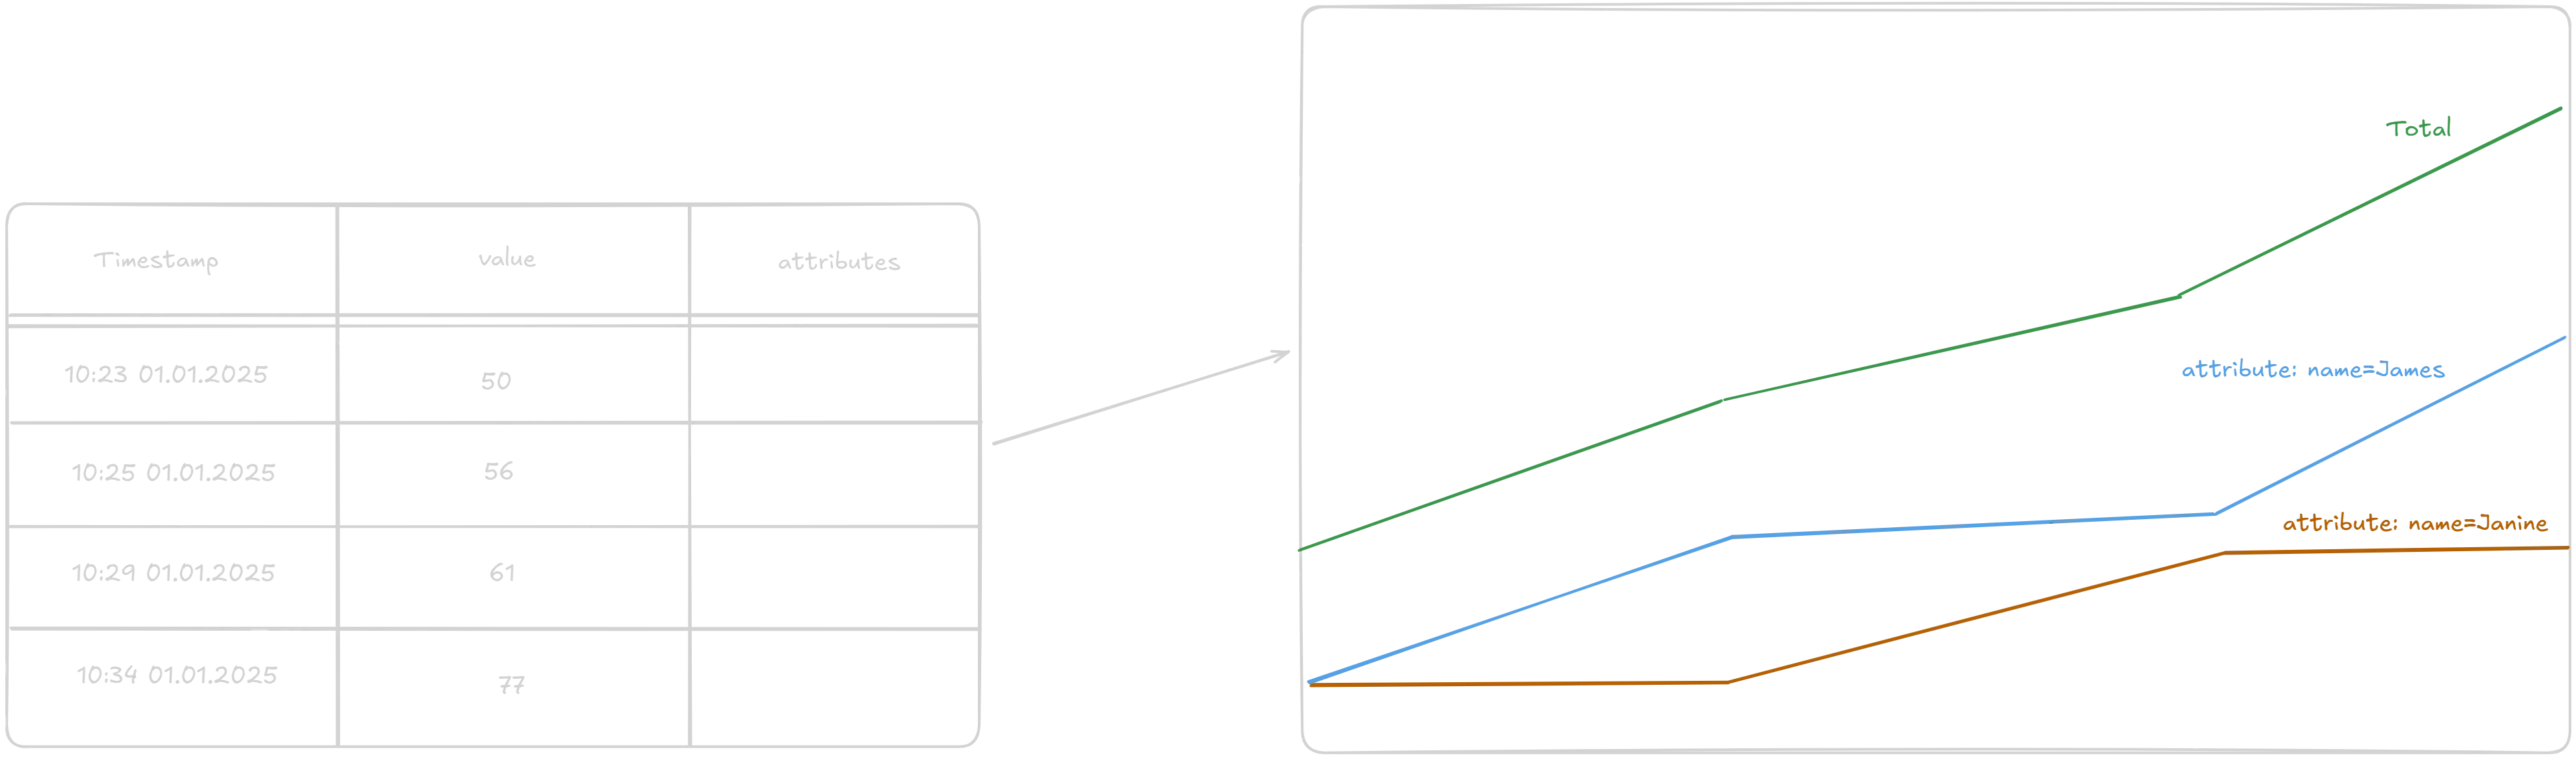
Metrics are numerical values that reflect the state of your application. They’re used to track performance, resource utilization, and other key aspects. Metrics are typically collected at regular intervals and can be visualized in dashboards or used to trigger alerts.
While OpenTelemetry didn’t invent these three pillars, it provides a framework, with SDKs and APIs in many popular programming languages, to generate, collect, and export these signals in a standardized way.
Instrumentation
Instrumentation is the act of generating these telemetry signals in your application. This can be done manually by utilizing the OpenTelemetry APIs and SDK directly in your code. You can create spans for individual function calls (e.g. such that are more time consuming and you want to measure their duration and find bottlenecks by utilizing traces) or you can create custom metrics (e.g. counters for specific events that happen in your application).
However, manually instrumenting your application can be time-consuming and error-prone. Therefore, OpenTelemetry also provides auto-instrumentation for many popular libraries and frameworks. This allows you to automatically generate telemetry signals without having to modify your application code. For example, if you are using a web framework like Spring Boot or Express.js, you can use the auto-instrumentation to automatically generate traces for incoming HTTP requests and outgoing HTTP calls.
@app.get("/")async def hello_world(name: str = "World"):    """Simple hello world endpoint with optional name parameter"""
    with tracer.start_as_current_span("hello-world-span", attributes={"name": name}):      logger.info(f"Received request with name: {name}")      counter.add(1, {"name": name})
    return {"message": f"Hello, {name}!"}
The best approach is to combine both manual and auto-instrumentation. Use auto-instrumentation as the default to generate telemetry signals for common operations, and add manual instrumentation where you want deeper insights or more context.
Meaningful logs should always be part of your development process and can’t be generated by auto-instrumentation alone. However, integrating your logs with OpenTelemetry helps you correlate logs with traces and metrics, making your logs even more valuable in the context of the traces and spans they belong to.
Exporters, Collectors, and Backends
Once you’ve generated logs, metrics, and traces in your application—whether through manual or auto-instrumentation—where should they go next? That’s where exporters and collectors come in. Exporters send telemetry data to a backend system for storage and analysis. The default is the OTLP exporter, which sends data in the OpenTelemetry Protocol (OTLP) format to a collector or backend that supports OTLP. You can swap this out for any other supported exporter. For example, to send data to Azure Application Insights, use the Azure Monitor OpenTelemetry Exporter. You can even use different exporters for each signal type—such as Prometheus for metrics and OTLP for traces and logs.
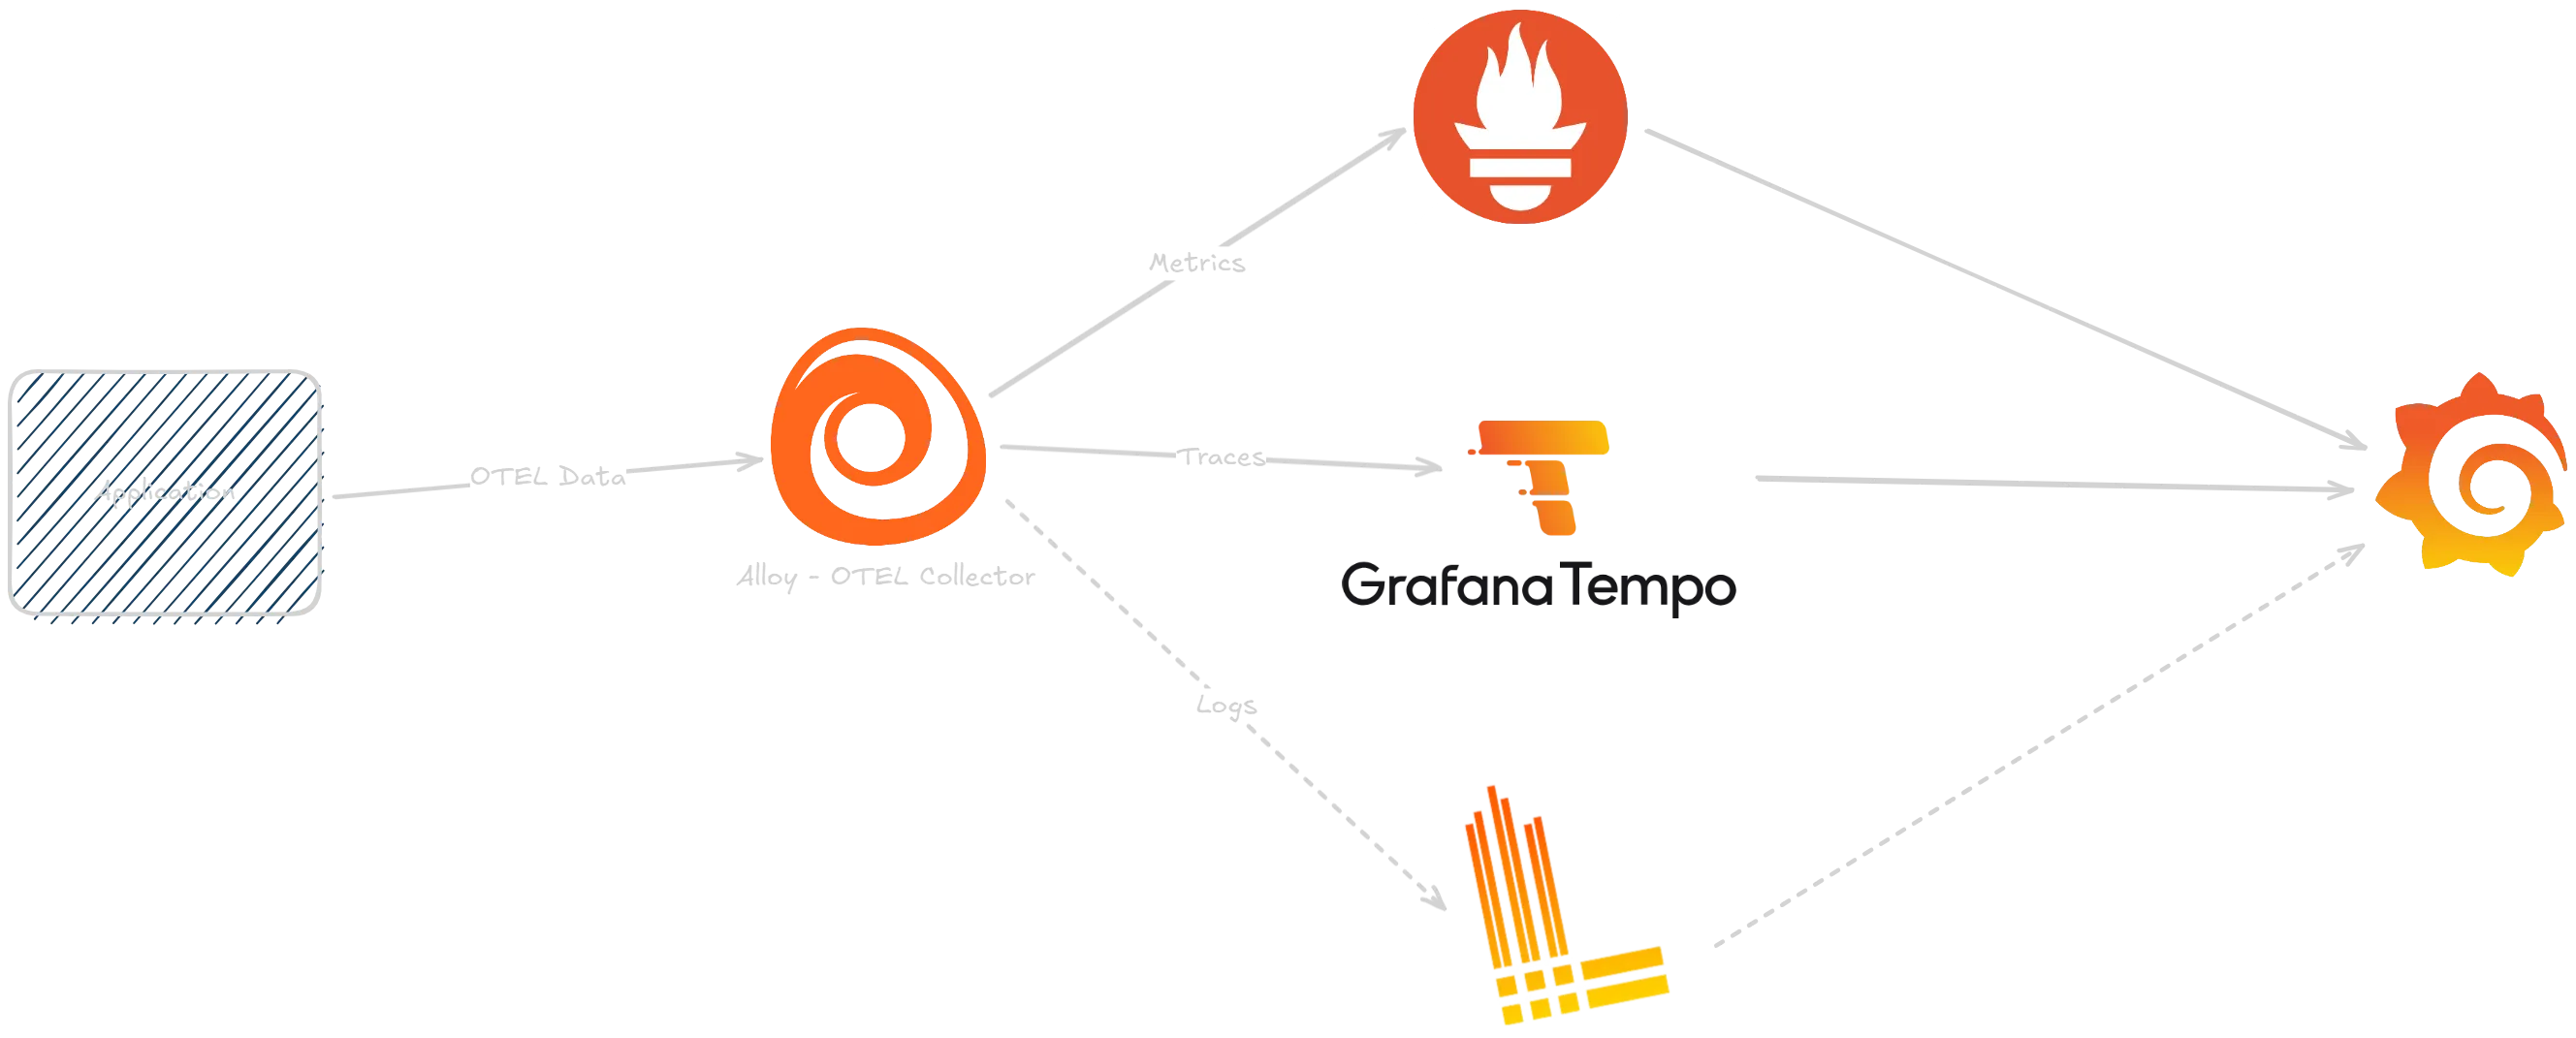
A collector shifts the responsibility of exporting data from your application to a separate process. This can simplify your application and let you rely on the OTLP protocol, while using different backend or storage technologies in your infrastructure. Grafana Alloy is a popular choice for this purpose. It can receive data from multiple sources, process it, and export it to various backends.
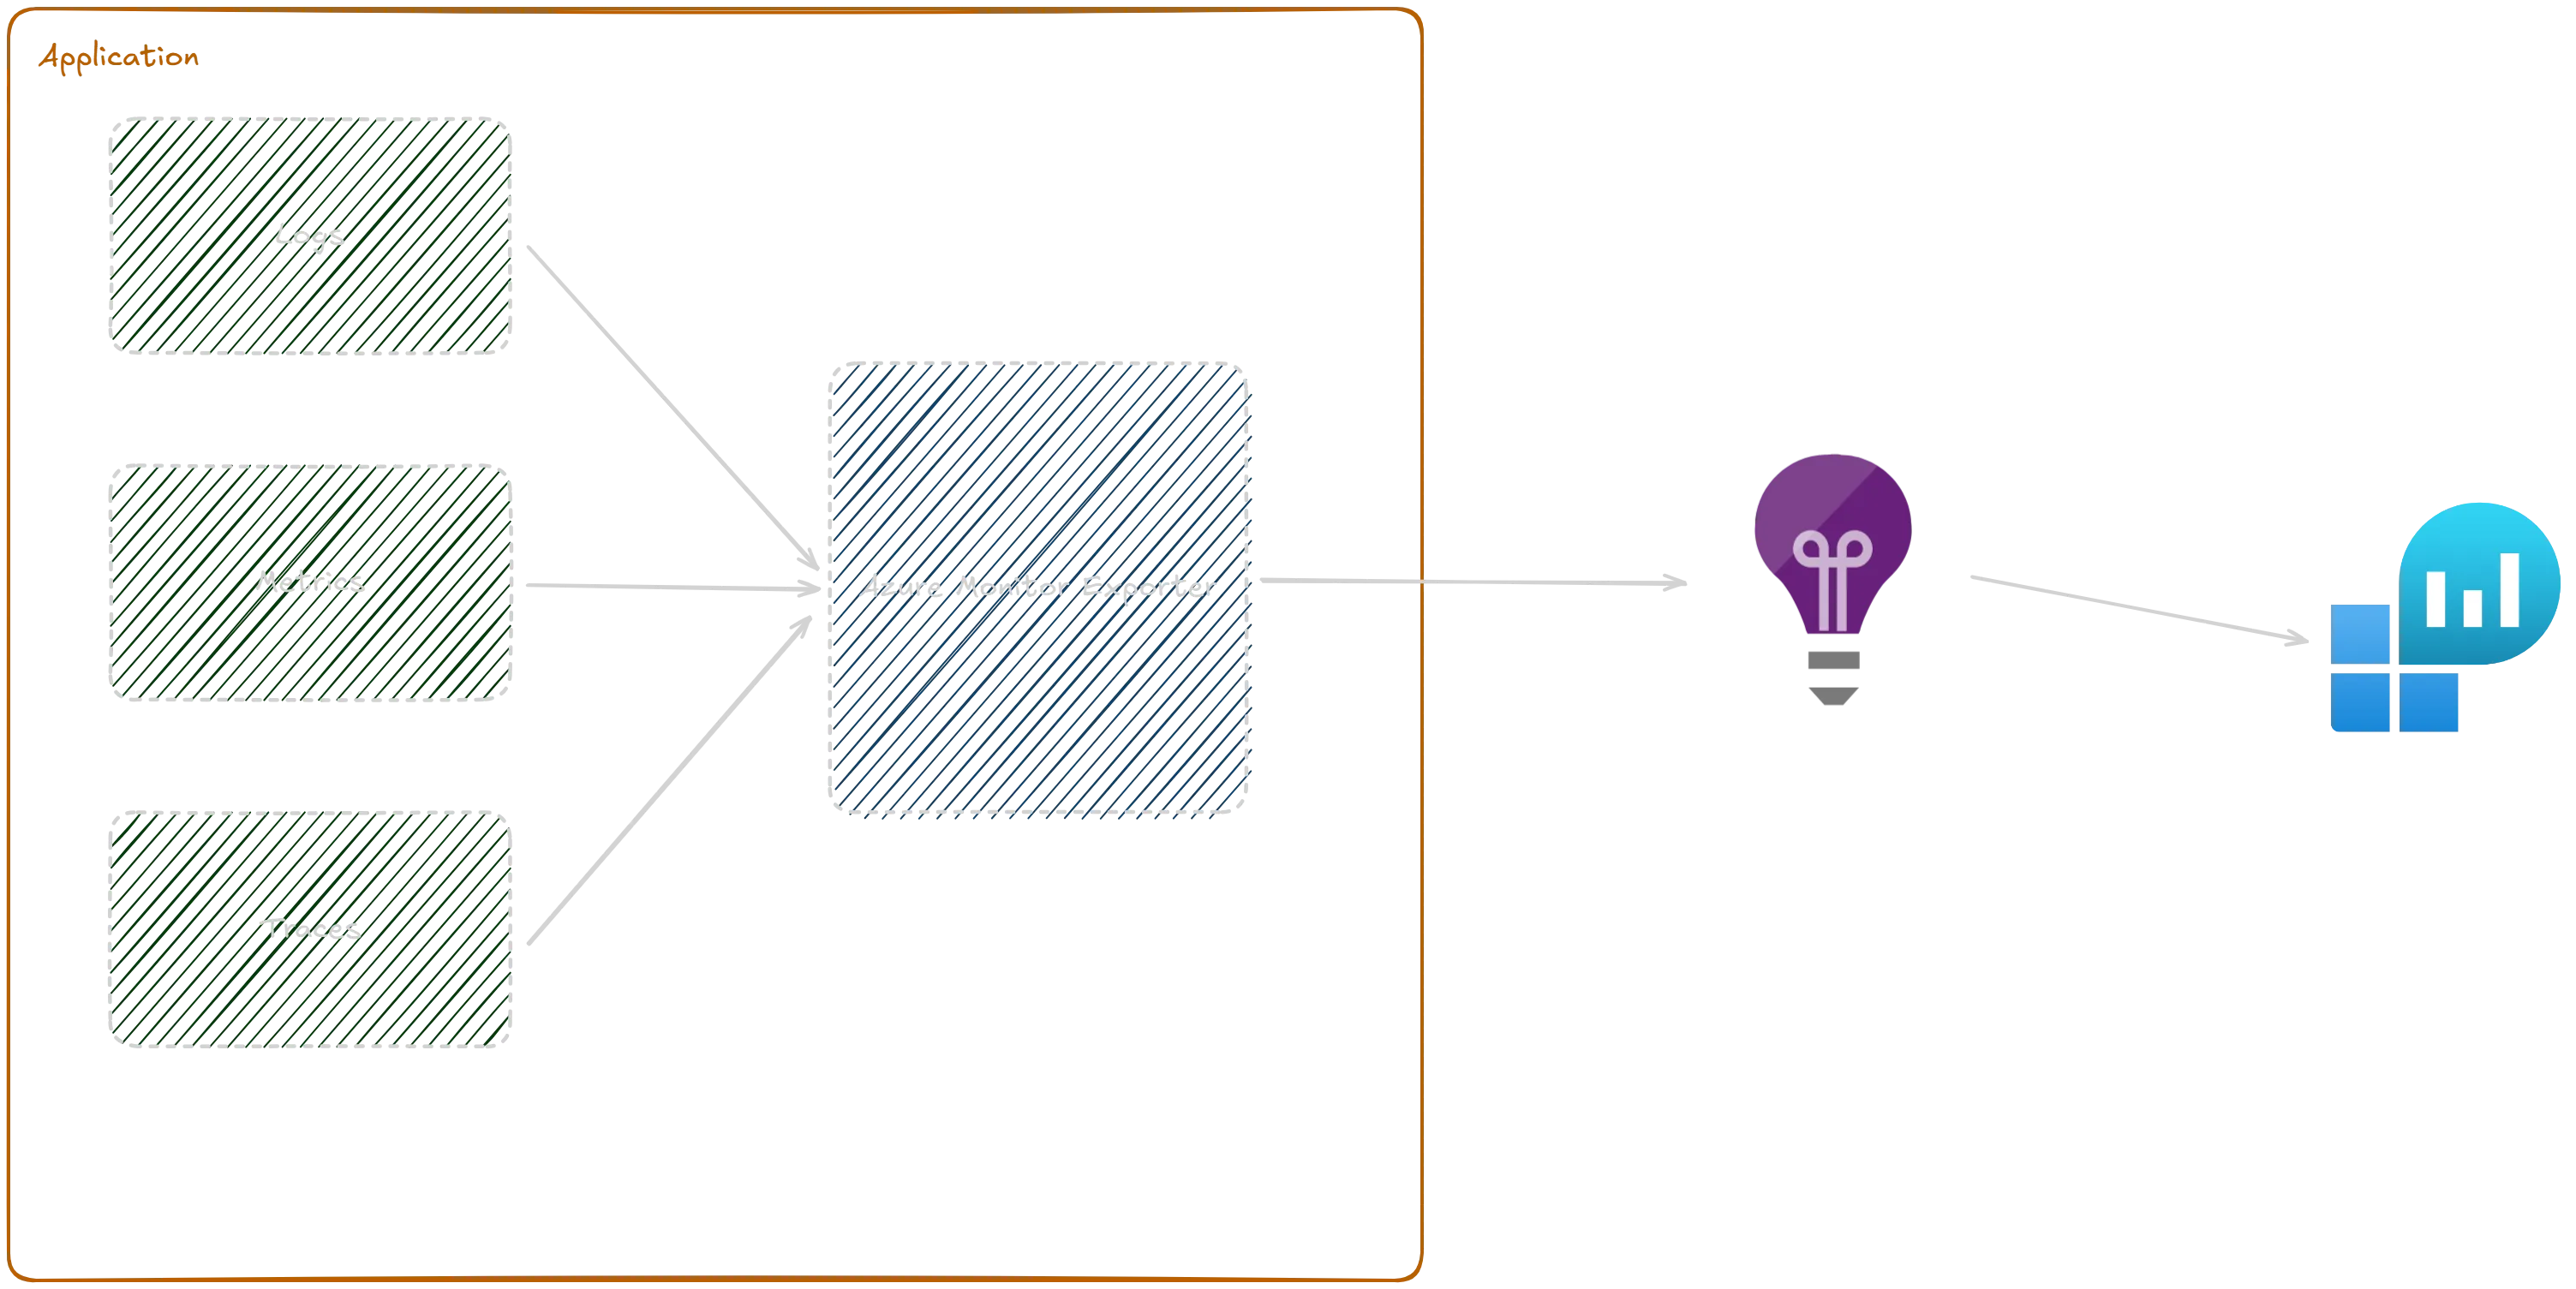
In a setup with Azure Application Insights, the Azure Monitor OpenTelemetry Exporter is used directly in your application. It sends data straight to Azure Application Insights, which stores logs, metrics, and traces in a Log Analytics Workspace and can visualize the data in dashboards and workbooks.
2. Setting up OpenTelemetry in your Application
Setting up OpenTelemetry in your application is quite straightforward:
- Install the correct OpenTelemetry package for your programming language and exporter of choice.
- Initialize the OpenTelemetry SDK and auto-instrumentation in your application code.
- Configure logging to be compatible with OpenTelemetry (if needed).
- Set necessary environment variables (e.g., connection string for Azure Application Insights).
- Import the instrumentation in your main application as early as possible.
1. Install OpenTelemetry Package
First, install the OpenTelemetry package(s) for your programming language. This provides the APIs and SDKs needed to generate telemetry data. You should also install the auto-instrumentation package for your language and your exporter of choice (e.g., Azure Monitor OpenTelemetry Exporter or OTLP Exporter).
You can also manually choose instrumentation packages for specific libraries. A list of available instrumentation packages for each language, as well as other components like exporters, can be found in the OpenTelemetry Registry.
pdm add opentelemetry-distro azure-monitor-opentelemetry-exporter
# Run opentelemetry bootstrap to autodetect and install instrumentation packages
pdm run opentelemetry-bootstrap -a installnpm install @opentelemetry/api @opentelemetry/auto-instrumentations-node @opentelemetry/exporter-azure-monitor pino# pino is a logging library that can be easily instrumented with OpenTelemetry<dependencyManagement> <dependencies> <dependency> <groupId>io.opentelemetry.instrumentation</groupId> <artifactId>opentelemetry-instrumentation-bom</artifactId> <version>2.20.1</version> <type>pom</type> <scope>import</scope> </dependency> </dependencies></dependencyManagement>
...
<dependencies> <dependency> <groupId>io.opentelemetry.instrumentation</groupId> <artifactId>opentelemetry-spring-boot-starter</artifactId> <version>2.20.1</version> </dependency>
<dependency> <groupId>com.azure</groupId> <artifactId>azure-monitor-opentelemetry-autoconfigure</artifactId> <version>1.3.0</version> </dependency></dependencies>2. Initialize OpenTelemetry SDK and Auto-Instrumentation
Next, initialize the OpenTelemetry SDK and/or auto-instrumentation in your application code. Depending on the language, this can be more or less involved. Ideally, do this in a separate module or file and import it as early as possible in your main application file, before any other imports you want instrumented.
from opentelemetry.instrumentation import auto_instrumentationfrom opentelemetry import trace, metrics
auto_instrumentation.initialize()
# Also export tracer and meter for manual instrumentation later ontracer = trace.get_tracer(__name__)meter = metrics.get_meter(__name__)import { NodeSDK } from "@opentelemetry/sdk-node";import { getNodeAutoInstrumentations } from "@opentelemetry/auto-instrumentations-node";import { PeriodicExportingMetricReader } from "@opentelemetry/sdk-metrics";import { AzureMonitorLogExporter, AzureMonitorMetricExporter, AzureMonitorTraceExporter,} from "@azure/monitor-opentelemetry-exporter";import { BatchLogRecordProcessor } from "@opentelemetry/sdk-logs";import { resourceFromAttributes } from "@opentelemetry/resources";import { ATTR_SERVICE_NAME } from "@opentelemetry/semantic-conventions";import { trace, metrics } from "@opentelemetry/api";
export default function setupOtel() { const APPLICATIONINSIGHTS_CONNECTION_STRING = process.env.APPLICATIONINSIGHTS_CONNECTION_STRING; const OTEL_SERVICE_NAME = process.env.OTEL_SERVICE_NAME;
if (APPLICATIONINSIGHTS_CONNECTION_STRING) { const traceExporter = new AzureMonitorTraceExporter({ connectionString: APPLICATIONINSIGHTS_CONNECTION_STRING, });
const metricExporter = new AzureMonitorMetricExporter({ connectionString: APPLICATIONINSIGHTS_CONNECTION_STRING, });
const logExporter = new AzureMonitorLogExporter({ connectionString: APPLICATIONINSIGHTS_CONNECTION_STRING, });
const sdk = new NodeSDK({ resource: resourceFromAttributes({ [ATTR_SERVICE_NAME]: OTEL_SERVICE_NAME, }), traceExporter: traceExporter, metricReader: new PeriodicExportingMetricReader({ exporter: metricExporter, }), instrumentations: [getNodeAutoInstrumentations()], logRecordProcessors: [new BatchLogRecordProcessor(logExporter)], }); sdk.start(); }}
// Also export tracer and meter for manual instrumentation later onexport const tracer = trace.getTracer("example-tracer-node");export const meter = metrics.getMeter("example-meter-node");@Configuration(proxyBeanMethods = false)@AutoConfigureBefore(OpenTelemetryAutoConfiguration.class)public class AzureMonitorAutoConfiguration { @Bean AutoConfigurationCustomizerProvider autoConfigurationCustomizerProvider( @Value("${applicationinsights.connection.string:#{null}}") String connectionString, ObjectProvider<AzureMonitorAutoConfigureOptions> azureMonitorAutoConfigureOptions) {
return autoConfigurationCustomizer -> AzureMonitorAutoConfigure.customize(autoConfigurationCustomizer, connectionString); }}3. Configure Logging
To get the most out of OpenTelemetry, you should also configure your logging library to be compatible. While not strictly necessary, this makes it much easier to correlate logs with traces and metrics. In Java and Python, you can use the standard logging libraries, while in Node.js, choose a logging library that supports OpenTelemetry out of the box, like Pino.
import logging
logging.basicConfig(level=logging.INFO)
# Suppress Azure Core HTTP logging by setting it to WARNING levellogging.getLogger("azure.core.pipeline.policies.http_logging_policy").setLevel(logging.WARNING)
# Suppress Azure Monitor OpenTelemetry exporter transmission logslogging.getLogger("azure.monitor.opentelemetry.exporter.export._base").setLevel(logging.WARNING)
# You can also suppress all Azure logging if needed# logging.getLogger("azure").setLevel(logging.WARNING)
logger = logging.getLogger(__name__)import logger from "pino";
const log = logger({ level: process.env.LOG_LEVEL || "info",});
export default log;// No special configuration needed if you use standard logging libraries like SLF4J or Logback4. Set Necessary Environment Variables
Finally, set the necessary environment variables for your application. This usually includes the connection string for your backend system (e.g., Azure Application Insights) and any other configuration options for the OpenTelemetry SDK and exporter. To start, it’s often enough to set the connection string and a service name to identify your application in the backend. Many more configuration options are available in the OpenTelemetry docs.
AZURE_MONITOR_CONNECTION_STRING="InstrumentationKey=YOUR_INSTRUMENTATION_KEY;IngestionEndpoint"OTEL_TRACES_EXPORTER=azure_monitor_opentelemetry_exporterOTEL_METRICS_EXPORTER=azure_monitor_opentelemetry_exporterOTEL_LOGS_EXPORTER=azure_monitor_opentelemetry_exporterOTEL_PYTHON_LOGGING_AUTO_INSTRUMENTATION_ENABLED=trueOTEL_SERVICE_NAME="otel-demo-python"APPLICATIONINSIGHTS_CONNECTION_STRING="InstrumentationKey=YOUR_INSTRUMENTATION_KEY;IngestionEndpoint"applicationinsights.connection.string="InstrumentationKey=YOUR_INSTRUMENTATION_KEY;IngestionEndpoint"5. Import in your main application
Be sure to import the instrumentation module as early as possible in your main application file, before any other imports you want instrumented.
import instrument # Ensure instrumentation is initialized
from fastapi import FastAPI
app = FastAPI(title="OpenTelemetry Demo API", version="1.0.0")
@app.get("/")async def hello_world(name: str = "World"):   """Simple hello world endpoint with optional name parameter"""
   logger.info(f"Received request with name: {name}")   return {"message": f"Hello, {name}!"}


if __name__ == "__main__": import uvicorn uvicorn.run(app, host="0.0.0.0", port=8000)import dotenv from "dotenv";dotenv.config();
import setupOtel from "./instrumentation";setupOtel();
import log from "./logging";
import express from "express";
const app = express();const port = process.env.PORT || 3000;
app.get("/", (req, res) => { const name = req.query.name || "World"; log.info(`Saying hello to ${name}`); res.send("Hello " + name);});
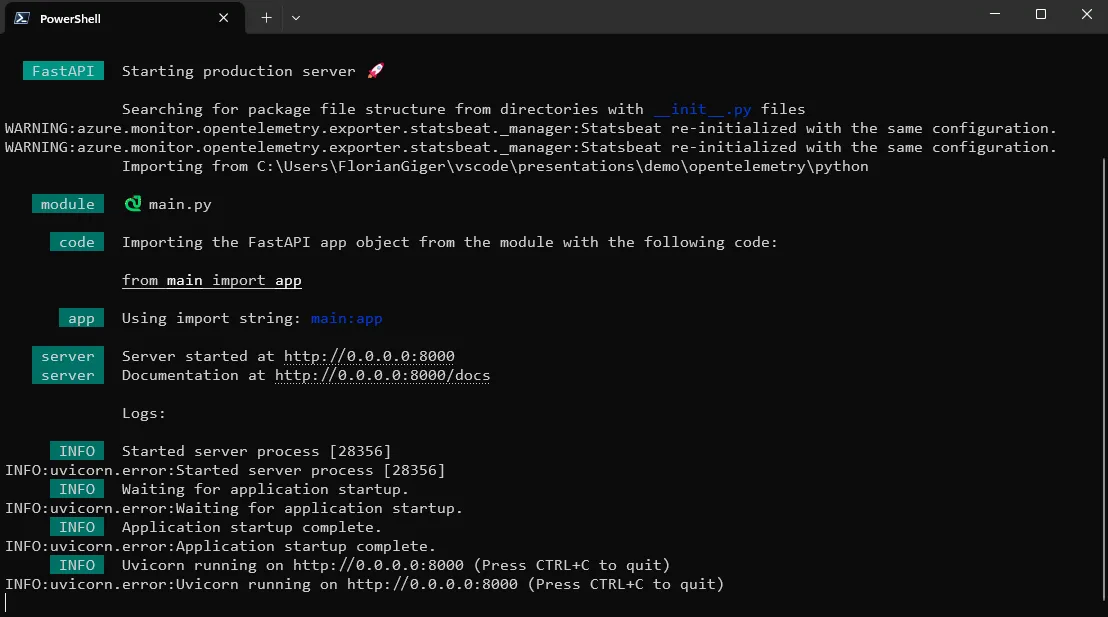
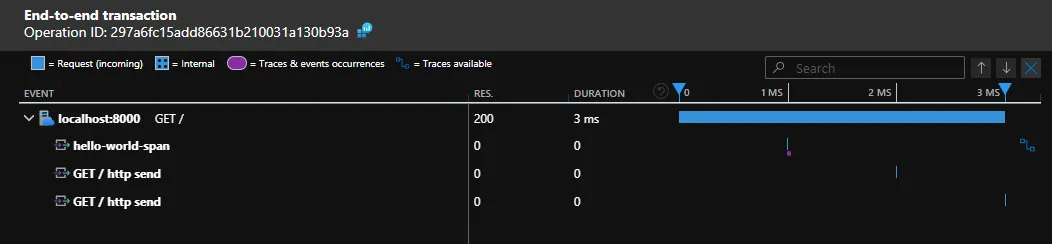
app.listen(port, () => { log.info(`Example app listening on port ${port}`);});// Again nothing to do in Spring Boot, as Spring Boot will automatically pick up the configuration and initialize OpenTelemetryNow, when you run your application, you should see telemetry data being sent to Azure Application Insights. HTTP requests to your web framework will be automatically instrumented, and your logs will appear in the traces as well.
3. Manual Instrumentation
While auto-instrumentation is great and covers many use cases, sometimes you’ll want to add extra context and detail to your telemetry data. That’s where manual instrumentation comes in. Use the OpenTelemetry APIs to create spans for individual function calls or custom metrics for specific events. This helps you gain deeper insights and identify issues that auto-instrumentation might miss.
You can use the tracer and meter exported from your instrumentation module (as shown above) to add manual instrumentation to your application code. Logs are created just as you normally would in your application.
from instrument import tracer, meter  # Ensure instrumentation is initialized
from fastapi import FastAPI
app = FastAPI(title="OpenTelemetry Demo API", version="1.0.0")
counter = meter.create_counter("name_counter", description="Counts names received")
@app.get("/")async def hello_world(name: str = "World"):   """Simple hello world endpoint with optional name parameter"""
   with tracer.start_as_current_span("hello-world-span", attributes={"name": name}):      logger.info(f"Received request with name: {name}")      counter.add(1, {"name": name})
   return {"message": f"Hello, {name}!"}


if __name__ == "__main__": import uvicorn uvicorn.run(app, host="0.0.0.0", port=8000)import dotenv from "dotenv";dotenv.config();
import setupOtel, { meter, tracer } from "./instrumentation";setupOtel();
import log from "./logging";
import express from "express";
const app = express();const port = process.env.PORT || 3000;
const nameCounter = meter.createCounter("name_counter");
app.get("/", (req, res) => { const span = tracer.startSpan("handling greeting"); span.setAttribute("name", (req.query.name as string) || "World");
nameCounter.add(1, { name: (req.query.name as string) || "World" });
const name = req.query.name || "World"; log.info(`Saying hello to ${name}`); res.send("Hello " + name);
span.end();});
app.listen(port, () => { log.info(`Example app listening on port ${port}`);});@RestController@Logpublic class DemoController {
private final Meter meter; private final LongCounter requestCounter;
public DemoController() { // Initialize OpenTelemetry meter this.meter = GlobalOpenTelemetry.getMeter("demo-controller");
// Create a counter metric this.requestCounter = meter .counterBuilder("name_counter") .setDescription("Total number of individual names processed") .setUnit("1") .build(); }
@GetMapping("/") public String hello(@RequestParam(value = "name", defaultValue = "World") String name) { // Increment the counter with attributes requestCounter.add(1, Attributes.of( AttributeKey.stringKey("name"), name));
log.info(String.format("Hello endpoint called with name: %s", name)); customMethod(name); return String.format("Hello %s!", name); }
@WithSpan private void customMethod(String name) { log.info(String.format("Im a custom span call with name: %s", name)); Span currSpan = Span.current(); currSpan.setAttribute("name", name); }
}For more advanced usage of manual instrumentation and the different types of available meters, check out the OpenTelemetry documentation.
Conclusion
OpenTelemetry is a powerful tool for gaining observability into your applications. Setting it up is straightforward these days, and with auto-instrumentation, you can set it up once and forget about it, until the day you need those insights to solve an issue.
You can find example code here.
Hint: If you don’t need the flexibility of a “low level” OpenTelemetry installation with the Azure Monitor Exporter, allowing you to switch to another backend in the future, you can also use Azure Monitor OpenTelemetry Distro directly. It comes with most dependencies prebundled, simplifying setup and reducing boilerplate even further.