Self Hosted Grafana OTel Stack
How to set up self-hosted OpenTelemetry using Grafana, Alloy, Loki, Tempo and Prometheus.

In past articles, I’ve shown how to set up OpenTelemetry in various programming languages and frameworks. But what is all of this worth if you have nowhere to send your telemetry data to? In this article, I will show you how to set up a very basic OpenTelemetry stack using Grafana Open Source products to test and experiment with OpenTelemetry at home or in other self-hosted environments. One important disclaimer though: This setup is by no means production-ready, since it is missing persistence, high availability, and security hardening. It is purely meant for learning and experimenting with OpenTelemetry.
Bill of Materials
OpenTelemetry consists of three types of data: Logs, Metrics and Traces. Each of these benefit from specialized storage solutions allowing efficient storage and querying of the data.
- Metrics: For storing metrics we will use Prometheus, which is a very popular open-source monitoring and alerting toolkit. It is widely used in the industry and has great integration with OpenTelemetry. Particularly as a homelabber you might already be familiar with Prometheus as it is often used for monitoring Kubernetes clusters and other infrastructure.
- Logs: For logs we will use Loki, which is a log aggregation system designed to be cost-effective and easy to operate. It is optimized for storing and querying logs from applications and infrastructure.
- Traces: For traces we will use Tempo, which is a distributed tracing backend that is designed to be easy to operate and scale. It is optimized for storing and querying traces from applications and services.
Apart from these storage backends, we also need an ingestion point to receive the OpenTelemetry data and a tool to visualize and analyze the data. Fortunately, Grafana Labs also provides solutions for both of these needs:
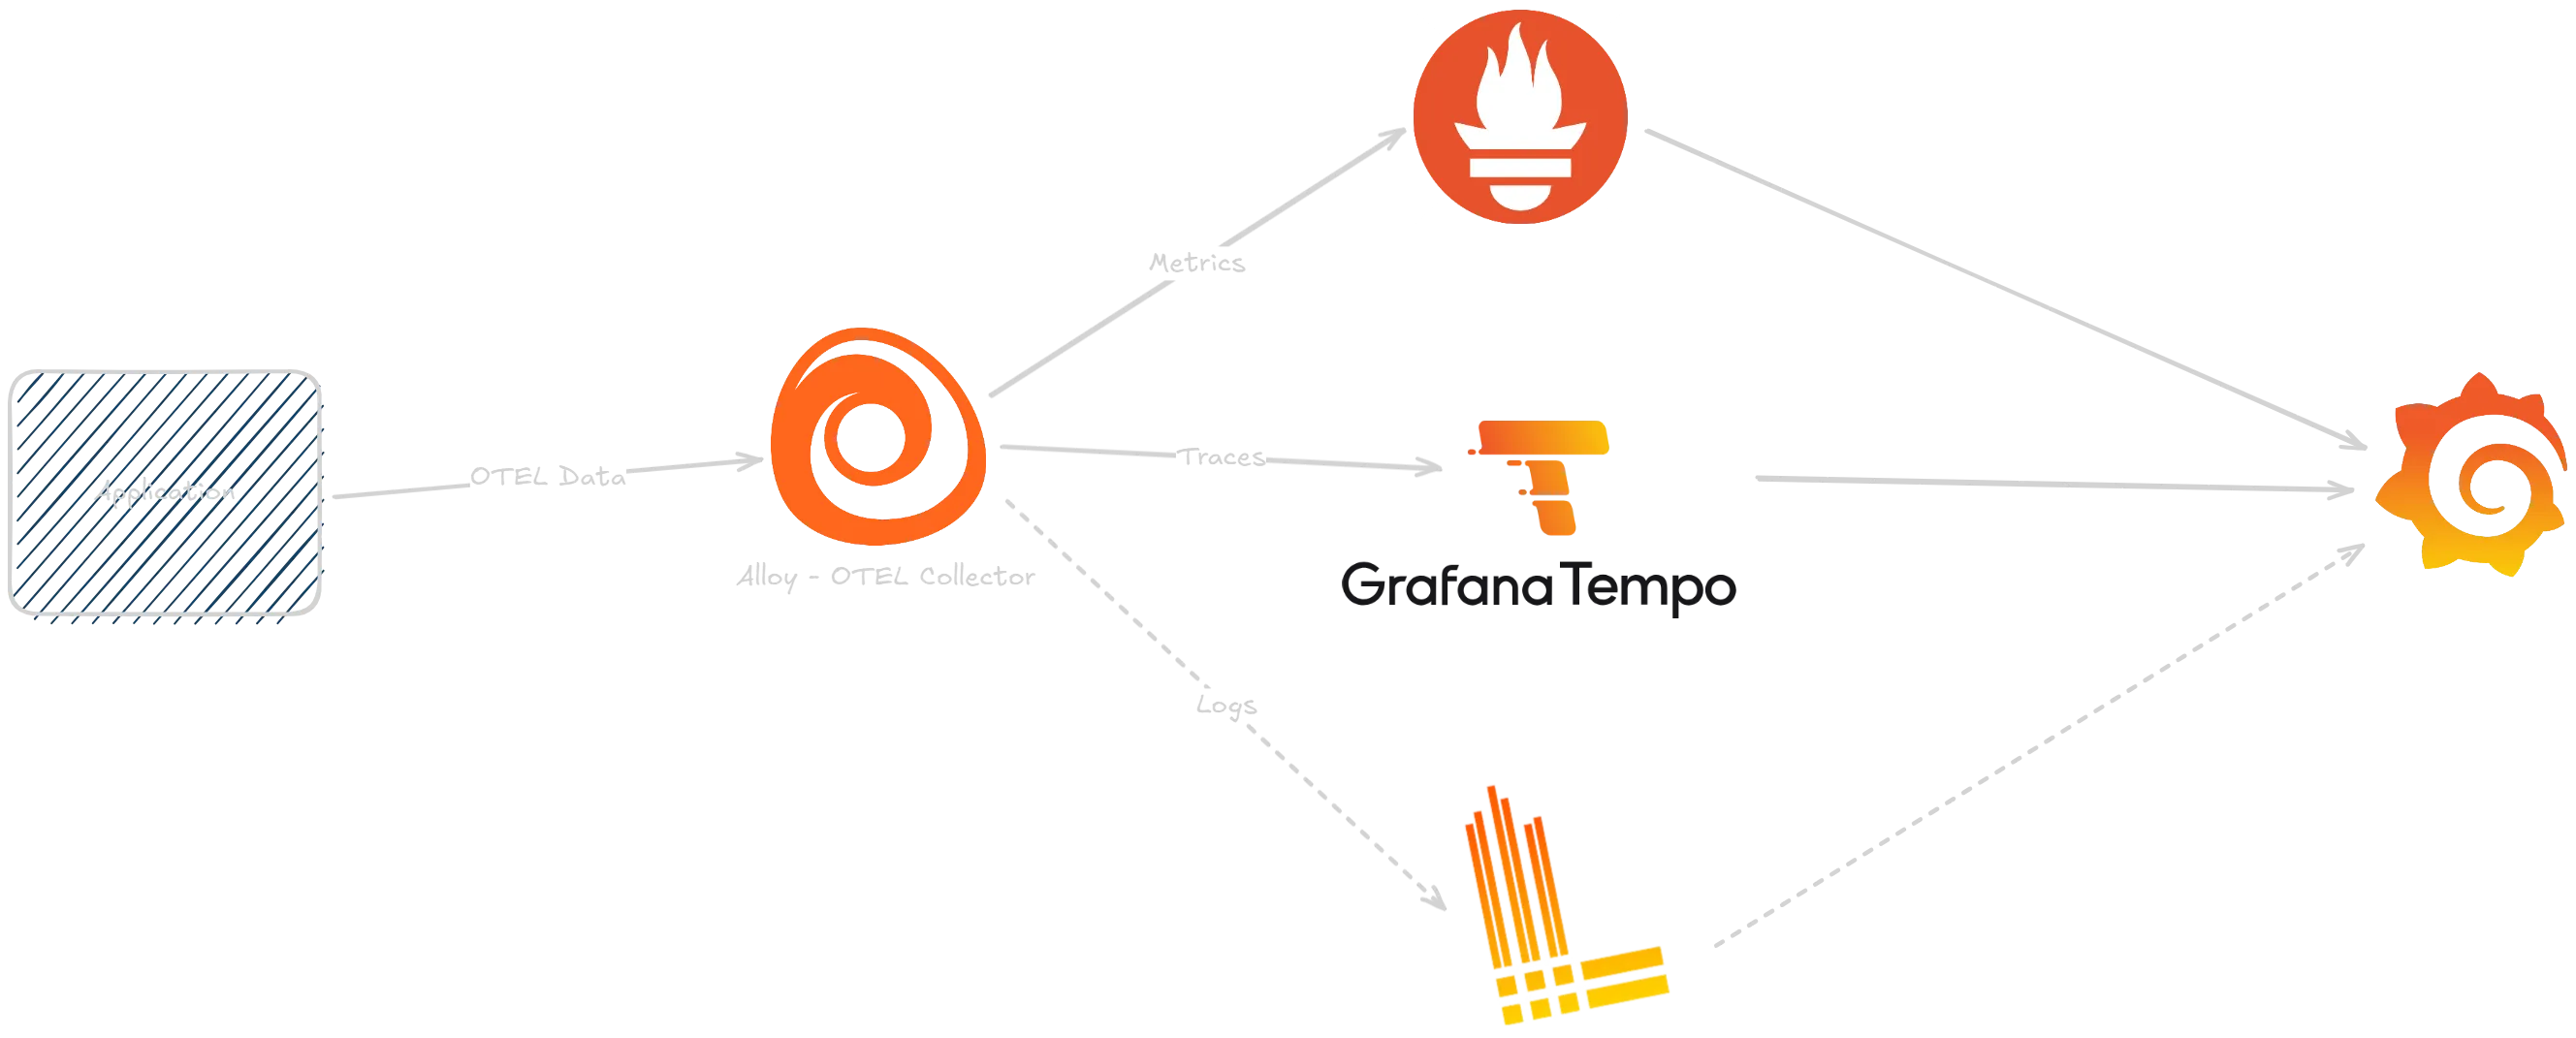
- Collector: For receiving the OpenTelemetry data we will use Grafana Alloy, which exposes an OTLP endpoint for ingesting OpenTelemetry data and can process and forward the data to the matching storage backends.
- Visualization: For visualizing and analyzing the data we will use the highly popular Grafana, which is a powerful and flexible dashboarding tool that integrates with all of the above storage backends.
The components will then be arranged like this:
Setting up Prometheus
Setting up Prometheus is fairly straightforward, as in this case we don’t need any of the scraping capabilities of Prometheus, since all data will be pushed to it via the OpenTelemetry Collector.
apiVersion: apps/v1kind: Deploymentmetadata:  name: prometheus  namespace: otel  labels:    app: prometheus  annotations:    reloader.stakater.com/auto: "true"spec:  replicas: 1  selector:    matchLabels:      app: prometheus  template:    metadata:      labels:        app: prometheus    spec:      containers:        - name: prometheus          image: prom/prometheus:v3.9.1          args:            - "--config.file=/etc/prometheus/prometheus.yml"            - "--storage.tsdb.path=/prometheus/"            - "--storage.tsdb.retention.time=24h"            - "--web.enable-remote-write-receiver"            - "--enable-feature=native-histograms"          ports:            - containerPort: 9090          volumeMounts:            - name: prometheus-config-volume              mountPath: /etc/prometheus/            - name: prometheus-storage-volume              mountPath: /prometheus/      volumes:        - name: prometheus-config-volume          configMap:            defaultMode: 420            name: prometheus-server-conf
- name: prometheus-storage-volume emptyDir: {}apiVersion: v1kind: ConfigMapmetadata: name: prometheus-server-conf labels: name: prometheus-server-conf namespace: oteldata: prometheus.yml: |- global: scrape_interval: 0s
scrape_configs: []apiVersion: v1kind: Servicemetadata: name: prometheus namespace: otelspec: selector: app: prometheus ports: - port: 9090 targetPort: 9090The important part here is the --web.enable-remote-write-receiver flag, which enables Prometheus to receive data via the remote write protocol, which is what the OpenTelemetry Collector will use to send metrics data to Prometheus.
Other than that we set the path to our configuration file and the storage path. For simplicity we use an emptyDir volume for storage, but in a real setup you would want to use a persistent volume.
I’ve limited the retention time to 24 hours for this example, but you can adjust this as needed.
The feature flag --enable-feature=native-histograms is required to enable histogram support in Prometheus, which is needed for some OpenTelemetry metrics.
The configuration file for Prometheus is very basic since we don’t need to scrape any targets. In fact, we can disable scraping altogether by setting the scrape_interval to 0s.
Setting up Loki
Setting up a single-instance Loki requires some configuration that disables certain replication and high availability features, which are not needed in this simple setup.
apiVersion: apps/v1kind: Deploymentmetadata: name: loki namespace: otel annotations: reloader.stakater.com/auto: "true"spec: replicas: 1 selector: matchLabels: app: loki template: metadata: labels: app: loki spec: volumes: - name: loki-config configMap: name: loki - name: loki-storage emptyDir: {} containers: - name: loki image: grafana/loki:3.6.4 args: - -config.file=/etc/loki/loki.yaml resources: limits: memory: "512Mi" cpu: "500m" requests: memory: "256Mi" cpu: "100m" volumeMounts: - name: loki-config mountPath: /etc/loki - name: loki-storage mountPath: /loki livenessProbe: httpGet: path: /ready port: 3100 initialDelaySeconds: 45 periodSeconds: 10 timeoutSeconds: 5 failureThreshold: 3 readinessProbe: httpGet: path: /ready port: 3100 initialDelaySeconds: 30 periodSeconds: 10 timeoutSeconds: 5 failureThreshold: 3 ports: - containerPort: 3100 name: http protocol: TCP - containerPort: 9096 name: grpc protocol: TCPapiVersion: v1kind: ConfigMapmetadata: name: loki namespace: oteldata: loki.yaml: | auth_enabled: false
server: http_listen_port: 3100 grpc_listen_port: 9096 log_level: info
common: path_prefix: /loki storage: filesystem: chunks_directory: /loki/chunks rules_directory: /loki/rules replication_factor: 1 ring: kvstore: store: inmemory
schema_config: configs: - from: 2024-01-01 store: tsdb object_store: filesystem schema: v13 index: prefix: index_ period: 24h
limits_config: retention_period: 168h # 7 days max_query_lookback: 168h
compactor: working_directory: /loki/compactor compaction_interval: 10m retention_enabled: true retention_delete_delay: 2h retention_delete_worker_count: 150 delete_request_store: filesystem
analytics: reporting_enabled: falseapiVersion: v1kind: Servicemetadata: name: loki namespace: otelspec: type: ClusterIP ports: - name: http port: 3100 protocol: TCP targetPort: 3100 - name: grpc port: 9096 protocol: TCP targetPort: 9096 selector: app: lokiAgain, we are mounting an emptyDir volume for storage, but in a real setup you would want to use a persistent volume.
I won’t go into too much detail about the configuration here, but the important parts are that we disable authentication, set the storage backend to filesystem, and configure retention settings. The service exposes both the HTTP and gRPC ports.
Setting up Tempo
Setting up Tempo is similar to Loki; we need to provide a configuration that disables high availability features and sets the storage backend to filesystem.
apiVersion: apps/v1kind: Deploymentmetadata: name: tempo namespace: otel annotations: reloader.stakater.com/auto: "true"spec: selector: matchLabels: app: tempo template: metadata: labels: app: tempo spec: volumes: - name: tempo-config configMap: name: tempo - name: tempo-storage emptyDir: {} containers: - name: tempo image: grafana/tempo:2.9.1 args: - -config.file=/conf/tempo.yaml resources: limits: memory: "512Mi" cpu: "500m" requests: memory: "256Mi" cpu: "200m" volumeMounts: - name: tempo-config mountPath: /conf - name: tempo-storage mountPath: /var/tempo livenessProbe: failureThreshold: 3 httpGet: path: /ready port: 3100 initialDelaySeconds: 30 periodSeconds: 10 successThreshold: 1 timeoutSeconds: 5 readinessProbe: failureThreshold: 3 httpGet: path: /ready port: 3100 initialDelaySeconds: 20 periodSeconds: 10 successThreshold: 1 timeoutSeconds: 5 ports: - containerPort: 3100 name: prom-metrics - containerPort: 4317 name: otlp-grpc - containerPort: 4318 name: otlp-httpapiVersion: v1kind: ConfigMapmetadata: name: tempo namespace: oteldata: overrides.yaml: | overrides: {} tempo.yaml: | multitenancy_enabled: false stream_over_http_enabled: true usage_report: reporting_enabled: false compactor: compaction: block_retention: 24h distributor: receivers: otlp: protocols: grpc: endpoint: 0.0.0.0:4317 http: endpoint: 0.0.0.0:4318 ingester: {} server: http_listen_port: 3100 storage: trace: backend: local local: path: /var/tempo/traces wal: path: /var/tempo/wal metrics_generator: registry: collection_interval: 5s external_labels: source: tempo cluster: k3s-home storage: path: /var/tempo/generator/wal remote_write: - url: http://prometheus:9090/api/v1/write send_exemplars: true processor: span_metrics: dimensions: - http.method - http.target - http.status_code - service.version service_graphs: dimensions: - http.method - http.target - http.status_code - service.version enable_virtual_node_label: true peer_attributes: - peer.service - db.name - db.system - db.system.name - server.address local_blocks: # Required for TraceQL queries with | rate() # Allows metrics-generator to read from completed blocks flush_to_storage: true traces_storage: path: /var/tempo/generator/traces querier: {} query_frontend: {} overrides: defaults: metrics_generator: processors: [service-graphs, span-metrics, local-blocks] # enables metrics generator generate_native_histograms: bothapiVersion: v1kind: Servicemetadata: name: tempo namespace: otelspec: type: ClusterIP ports: - name: tempo-prom-metrics port: 3100 protocol: TCP targetPort: 3100 - name: grpc-tempo-otlp port: 4317 protocol: TCP targetPort: 4317 - name: tempo-otlp-http port: 4318 protocol: TCP targetPort: 4318 selector: app: tempoAgain, we are limiting the retention time to 24 hours. Additionally, we enable the metrics generator, which allows us to generate metrics from trace data, which is needed for the best experience in Grafana. These metrics are generated based on the spans ingested into Tempo and directly written to Prometheus via remote write.
Setting up Grafana Alloy
With all storage backends in place, we can now set up the OpenTelemetry Collector using Grafana Alloy. The collector will receive all OpenTelemetry data and forward it to the matching storage backends.
apiVersion: apps/v1kind: Deploymentmetadata: name: alloy namespace: otel annotations: reloader.stakater.com/auto: "true"spec: selector: matchLabels: app: alloy template: metadata: labels: app: alloy spec: volumes: - name: config configMap: name: alloy containers: - name: alloy image: grafana/alloy:v1.12.2 args: - run - /etc/alloy/config.alloy - --storage.path=/tmp/alloy - --server.http.listen-addr=0.0.0.0:12345 - --server.http.ui-path-prefix=/ - --stability.level=generally-available resources: limits: memory: "256Mi" cpu: "200m" requests: memory: "128Mi" cpu: "100m" ports: - containerPort: 12345 name: http - containerPort: 4317 name: otlp-grpc - containerPort: 4318 name: otlp-http readinessProbe: httpGet: path: /-/ready port: 12345 scheme: HTTP initialDelaySeconds: 10 timeoutSeconds: 1 volumeMounts: - name: config mountPath: /etc/alloyapiVersion: v1kind: ConfigMapmetadata: name: alloy namespace: oteldata: config.alloy: | logging { level = "info" format = "logfmt" }
// ======================================== // OTEL - Traces, Metrics & Logs // ======================================== otelcol.receiver.otlp "otlp" { grpc { endpoint = "0.0.0.0:4317" }
http { endpoint = "0.0.0.0:4318" }
output { traces = [otelcol.exporter.otlp.tempo.input] metrics = [otelcol.exporter.prometheus.prom.input] logs = [otelcol.exporter.loki.loki.input] } }
// ======================================== // Metric and Trace Exporters // ======================================== // Note: Span metrics and service graphs are generated in Tempo's // metrics-generator for better integration with TraceQL queries
otelcol.exporter.prometheus "prom" { forward_to = [prometheus.remote_write.default.receiver] }
prometheus.remote_write "default" { endpoint { url = "http://prometheus:9090/api/v1/write" } }
otelcol.exporter.otlp "tempo" { client { endpoint = "tempo:4317" tls { insecure = true } } }
// ======================================== // Logs - OTLP to Loki // ======================================== otelcol.exporter.loki "loki" { forward_to = [loki.write.loki.receiver] }
loki.write "loki" { endpoint { url = "http://loki:3100/loki/api/v1/push" } }apiVersion: v1kind: Servicemetadata: name: alloy namespace: otelspec: ports: - name: http port: 12345 targetPort: 12345 - name: otlp-grpc port: 4317 targetPort: 4317 - name: otlp-http port: 4318 targetPort: 4318 selector: app: alloyapiVersion: networking.k8s.io/v1kind: Ingressmetadata: name: alloy namespace: otel labels: name: alloyspec: rules: - host: alloy.example.com http: paths: - pathType: Prefix path: "/" backend: service: name: alloy port: number: 12345 - host: otlp.alloy.example.com http: paths: - pathType: Prefix path: "/" backend: service: name: alloy port: number: 4318Since Alloy is just the collector, it doesn’t need any persistent storage, so we can skip that here.
As you can see in the configuration, it pretty much describes a graph of how data flows through the collector. We define an OTLP receiver that listens on both gRPC and HTTP ports for incoming OpenTelemetry data. The received traces, metrics, and logs are then forwarded to the respective exporters, which send the data to Tempo, Prometheus, and Loki. The ingress configuration allows receiving OTLP traffic from outside the cluster.
Configuring Grafana to use the data sources
With all components set up, we can now configure Grafana to use the data sources. I’ll skip explaining how to deploy Grafana itself and assume we already have a running Grafana instance.
In order to explore our OpenTelemetry data, we need to add the data sources for Prometheus, Loki, and Tempo in Grafana.
Adding Prometheus Data Source
Adding the Prometheus data source is straightforward. In Grafana, navigate to Connections > Data Sources and click on Add data source. Select Prometheus from the list and configure it as follows:
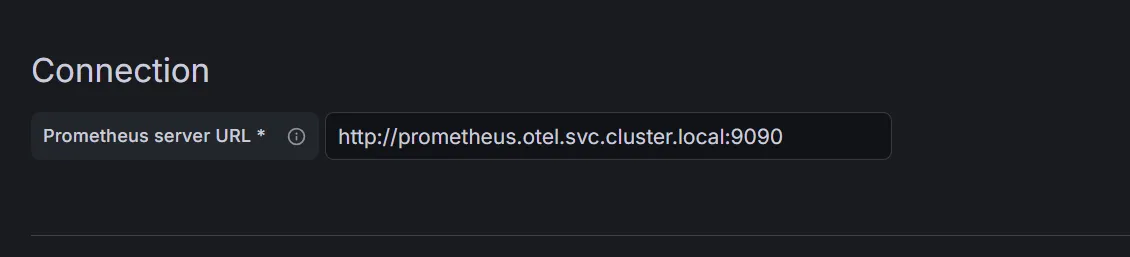
All other settings can be left on default.
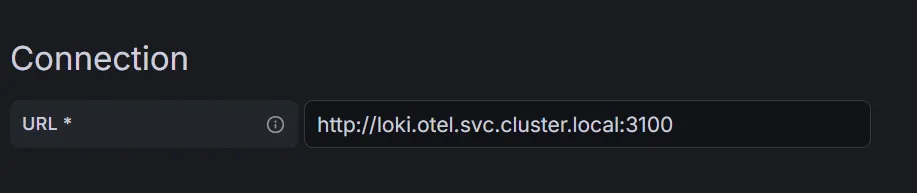
Adding Loki Data Source
When adding Loki as a data source we also want to configure some correlation settings.
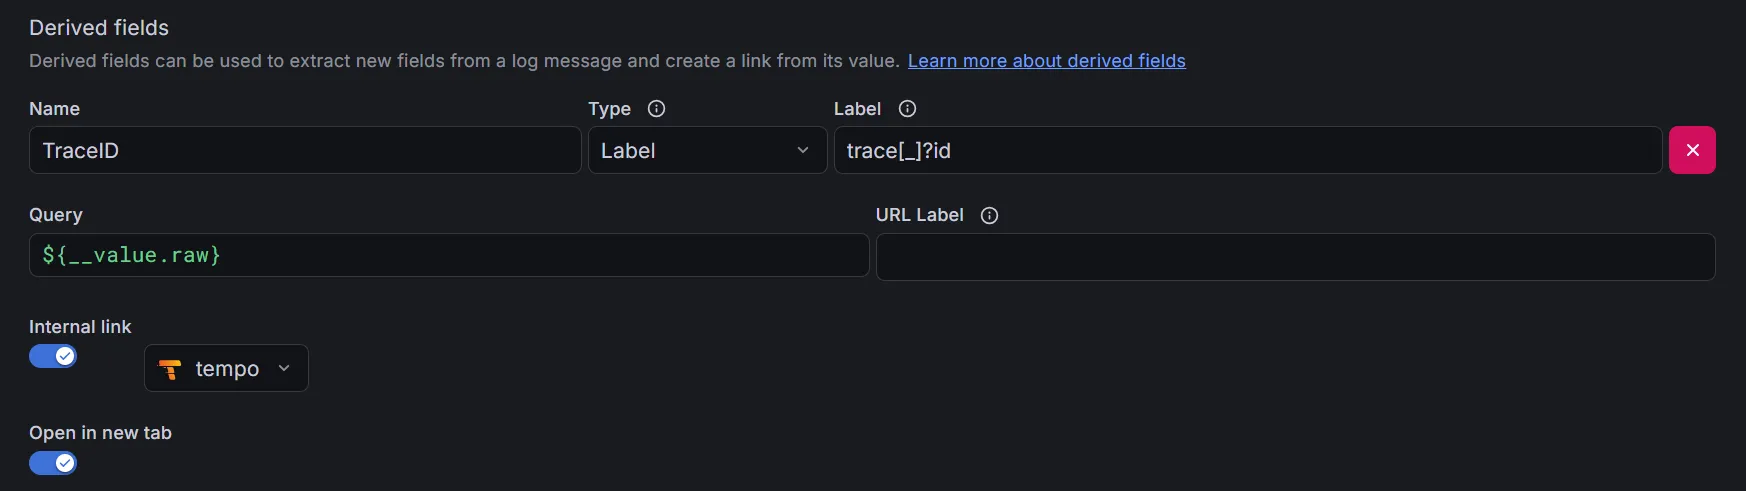
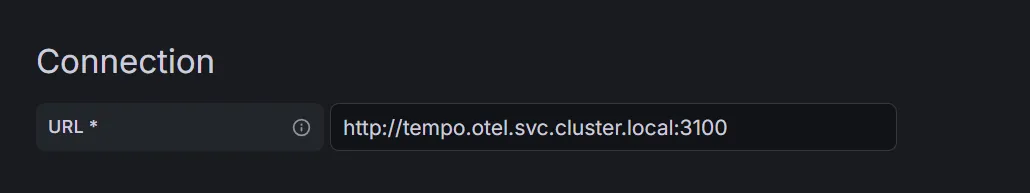
Adding Tempo Data Source
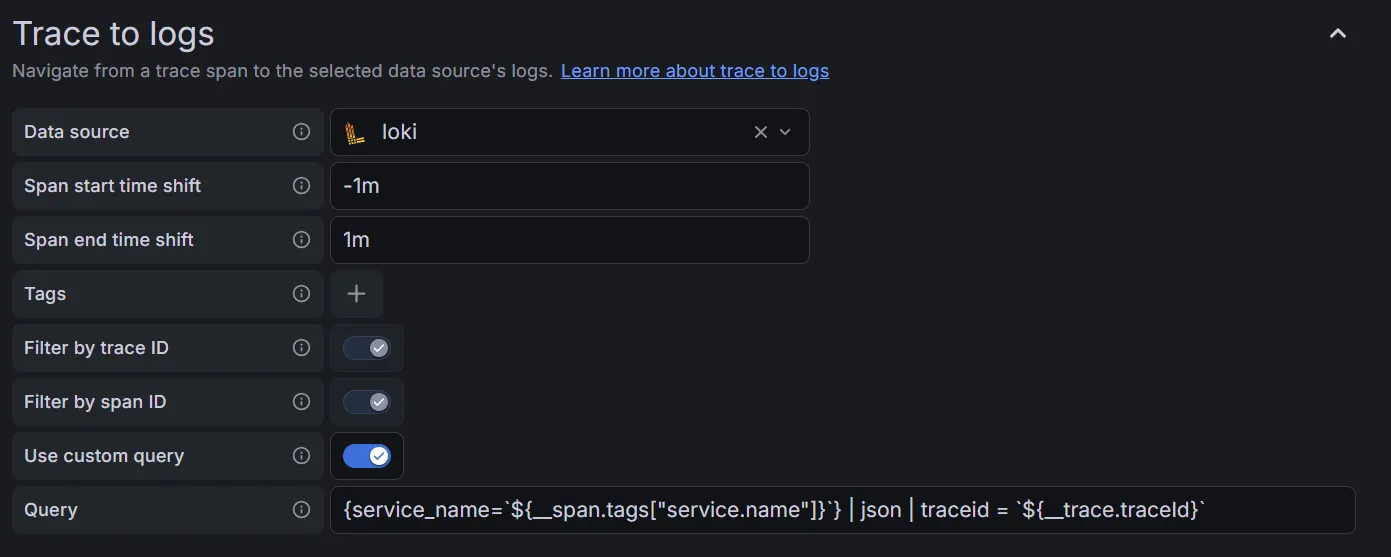
For Tempo, it’s just the same: we configure the URL and some correlation settings as well, so we can jump from traces to logs and back. It’s advisable to set some span start and end time shift so that any clock skew doesn’t kill the correlation:
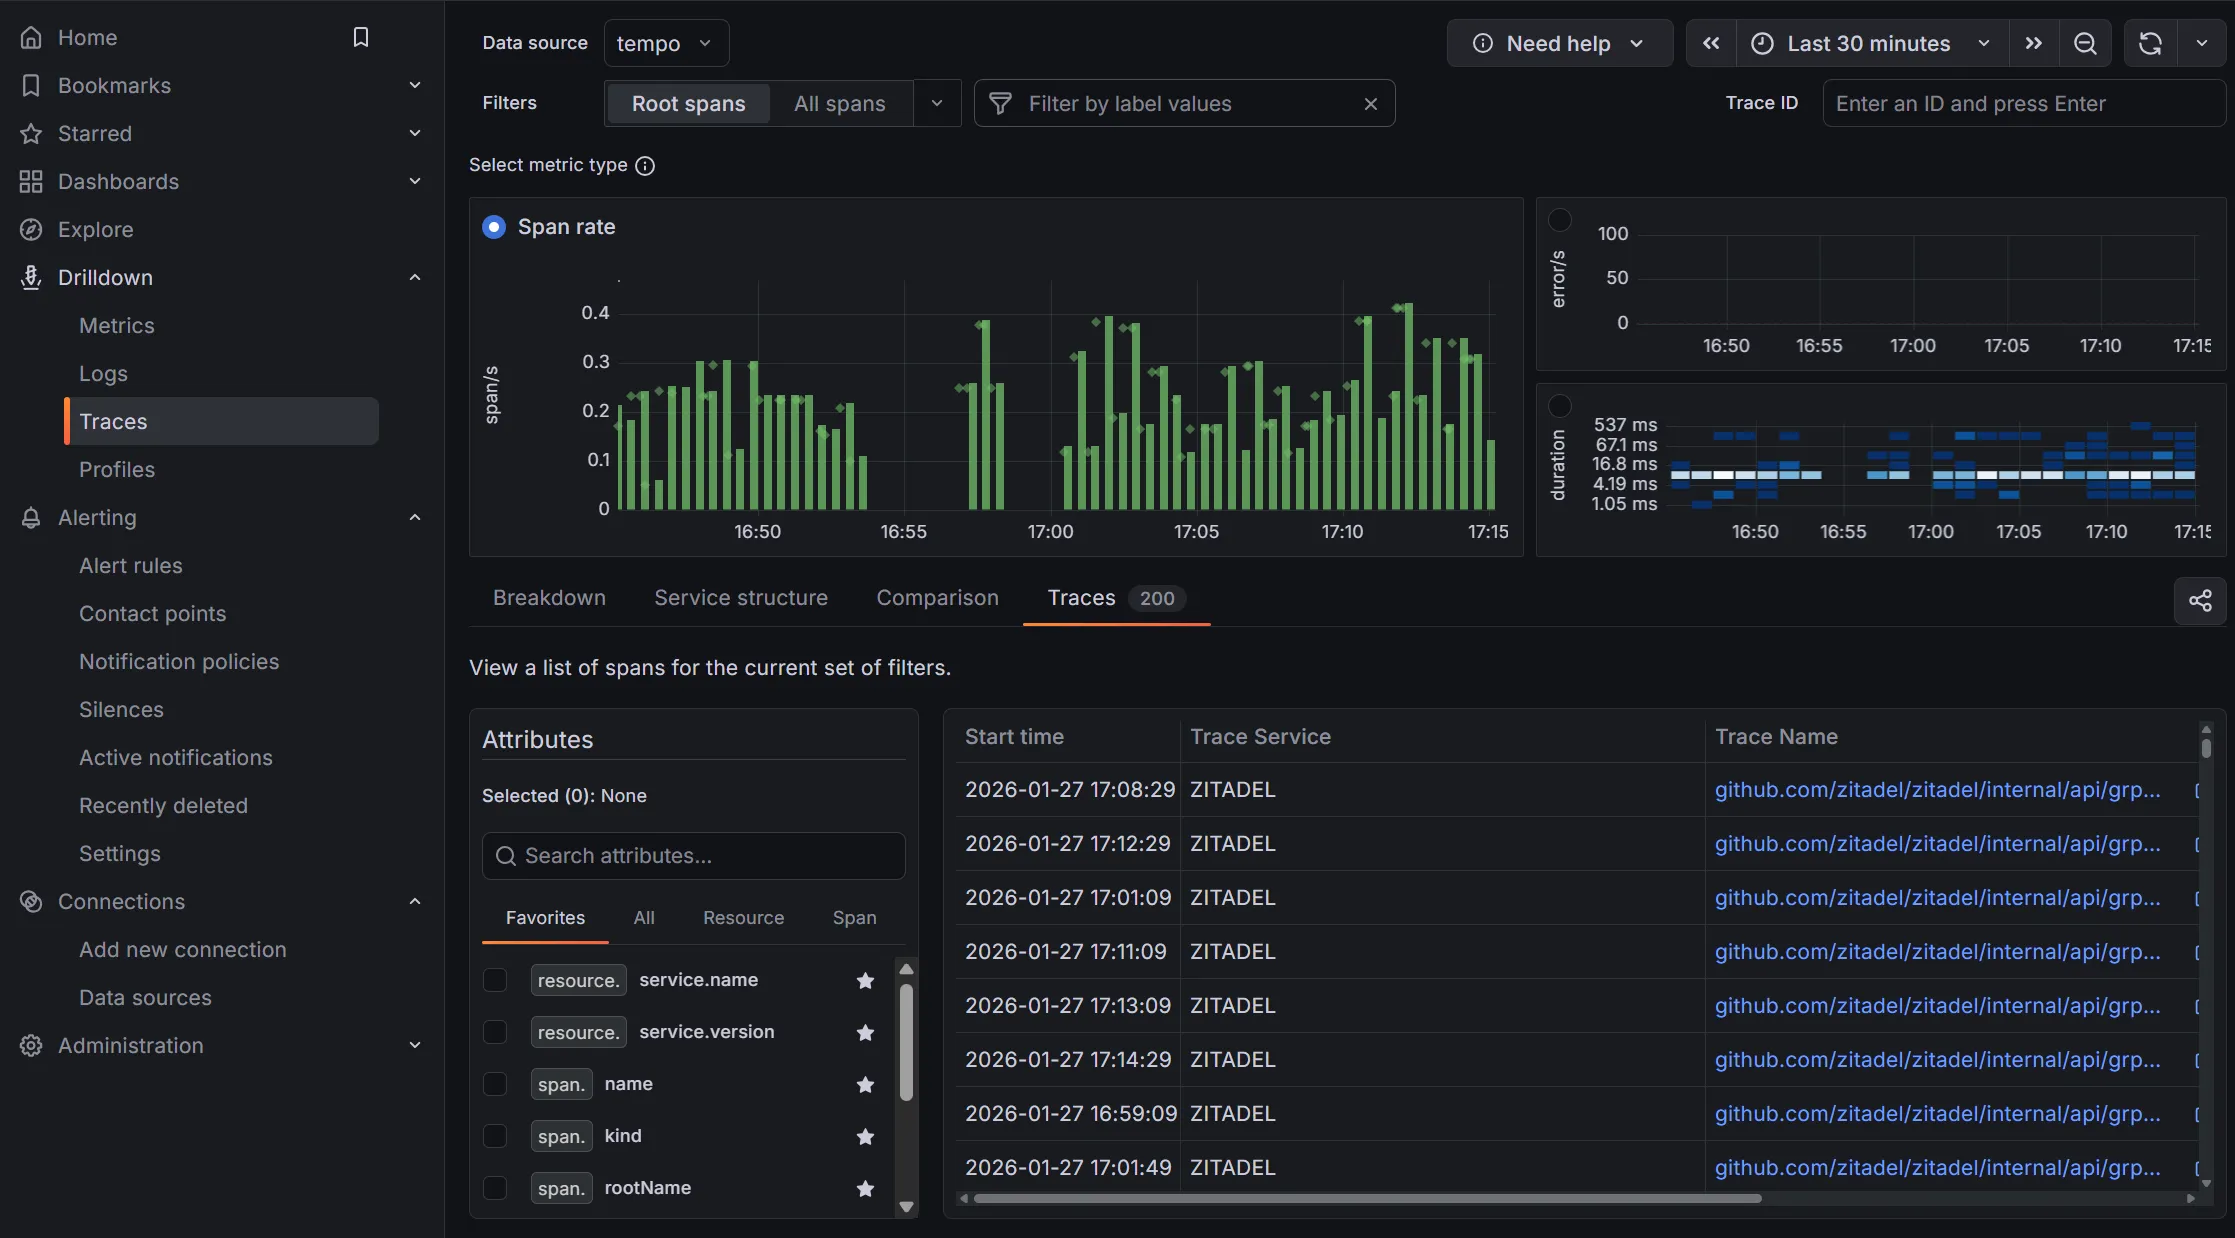
Harvesting the fruits
With all data sources configured, we can now start exploring our OpenTelemetry data in Grafana. We can create dashboards that visualize traces, metrics, and logs all in one place. The correlation settings we configured earlier will allow us to easily jump between related data points, making it much easier to troubleshoot issues and gain insights into our applications.
Grafana’s Drilldown feature gives us easy entry points into our OpenTelemetry data. With the metrics-generator we configured for Tempo, we can now also see metrics and statistics derived from traces directly in Grafana, as well as Service Maps.